accidental painting characterization
kkkkkkk
Accidental Painting Characterization


Accidental Painting Characterization
Spring 2017
2.671 — Instrument and Measurement @MIT
Skills Developed — research, experimental setup development, Matlab image processing
Documentation — full paper
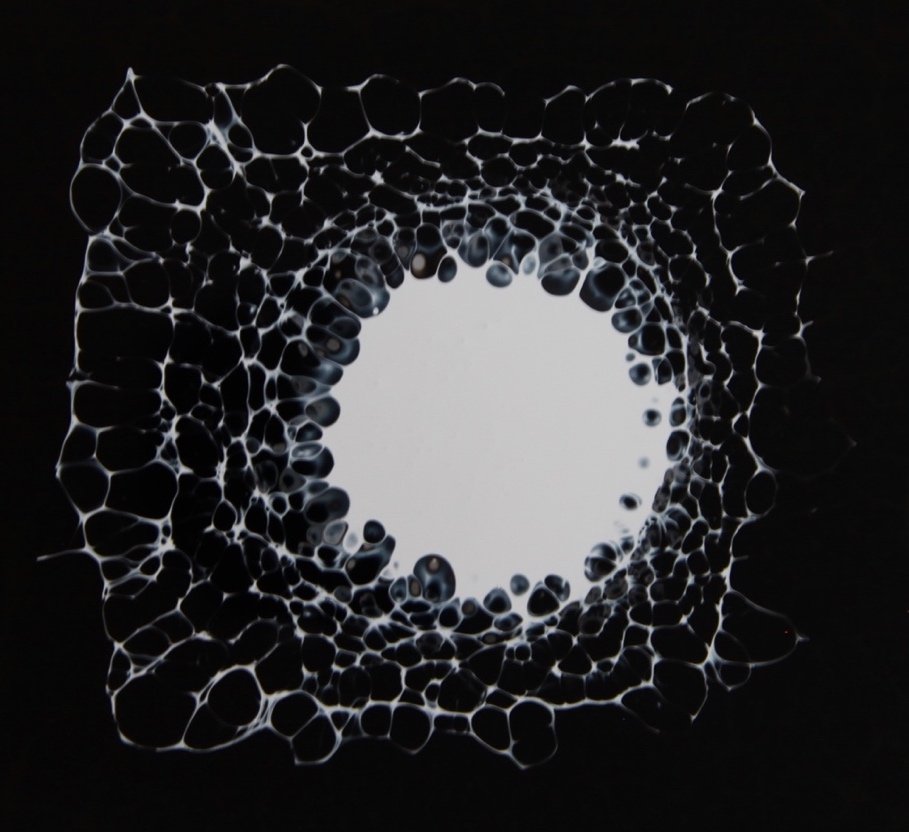
In the mid 1900s, artists began to experiment with a technique called accidental painting which was characterized by an explosion of radiating lines and droplets. The fluid interaction that makes up this effect occurs when a layer of paint is poured on top of another layer. The density difference between the two paints drives this pattern formation. However, tools to manipulate the “accidental” art is not fully understood. This study aimed to characterize how paint volume ratios affect pattern formation.
This unique pattern has two critical characteristics: spatial frequency, referring to how densely spaced the droplets are radiating from the center, and the droplet size, the area of each droplet. With a strive to translate the study into meaningful metrics for artists, the two characteristics were evaluated by paint volume.
A standard experimental set up was developed to evaluate the varying volumes and capture final results. To analyze droplet spatial frequency, cross correlation and fast fourier transforms were used in the image processing. To find the size of the droplets within the pattern, computer vision was implemented. See details on the computations below.
In conclusion, increasing the ratio of black to white does not affect the spatial frequency of the droplets but does increase the droplet size. The results from the study hope to inform artists on the painting technique, curator’s knowledge for preservation and art process, and aid in modeling future fluid interactions studies.

The series of images on the right is the image detail used for analysis. From left to right, it proceeds through each variation: 19 ml, 28 ml, 38 ml, 48 ml, 58 ml of black lacquer. Each image is taken from the upper right side of the white circle, with a height of 444 pixels the width 562 pixel.

A progression of the processes conducted to analyze the droplet size. From left to right, the processes the image undergoes is first a grayscale, then morphological processing, and lastly the results are entered into a histogram

A progression of the processes conducted to analyze the spatial frequency. From left to right, the processes the image undergoes is a Gaussian filter, then an autocorrelation, then a FFT, and lastly an integrated PSD.

